itpseq.Sample.codon_violin#
- Sample.codon_violin(pos, *, motif=None, query=None, col='log2FoldChange', sort_by='median', line_color='k', line_width=0.625, ax=None, violin_kwargs=None, **kwargs)[source]#
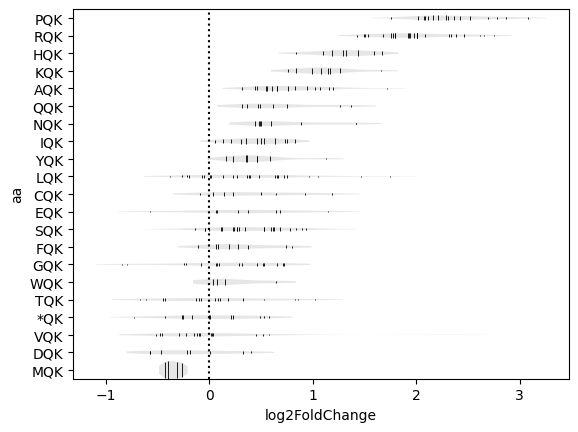
Plots violin plots for each amino acid motif, with one line per combination of codons.
- Parameters:
pos (str) – Position to use to compute the
DE(in amino-acid positions).motif (str) – Regex used to filter the data by protein motif. This parameter is strongly recommended for motifs of more than one amino-acid.
query (str or callable, optional) – Query string or callable used to filter the rows of the input. If a callable, should return a boolean Series/array to filter the rows.
col (str, optional) – Column from the output of
DEto use as the Y-axis.sort_by (str, optional) – Method to use to sort the violin plots. Defaults to ‘median’.
line_color (str, optional) – Color of the inner lines in the violin plot.
line_width (float, optional) – Width of the inner lines in the violin plot.
ax (matplotlib.Axes, optional) – If passed, will plot on this Axes.
violin_kwargs (dict, optional) – Parameters passed to violinplot.
kwargs (dict, optional) – Parameters passed to
DE.
Notes
This method should be used with a filter to avoid producing extremely large graphs.
Examples
Create violin plots for -2:P positions with Q/K fixed in the E/P sites.
>>> sample.codon_violin(pos='-2:P', motif='.QK')