itpseq.Sample.itp_len_plot#
- Sample.itp_len_plot(ax=None, min_codon=0, max_codon=10, limit=100, norm=True, kind='line', row=None, col=None, plt_kwargs={'aspect': 3, 'height': 2}, **kwargs)[source]#
Generates a plot of inverse-toeprint (ITP) counts per length.
This method uses the output of itp_len to create a plot showing the counts of inverse-toeprints across lengths for each replicate. Optionally, counts can be normalized (per million reads), and the plotted lengths can be limited.
- Parameters:
ax (matplotlib.axes.Axes, optional) – Pre-existing axes to draw the plot on. A new figure and axes are created if not provided.
min_codon (int, optional) – The minimum codon position to annotate on the plot. Defaults to 0.
max_codon (int, optional) – The maximum codon position to annotate on the plot. Defaults to 10.
limit (int, optional) – The maximum length to include in the plot. Defaults to 100.
norm (bool, optional) – Whether to normalize counts to reads per million. Defaults to True.
kind (str) – Type of plot to use. Defaults to ‘line’.
row (str, optional) – attribute to use as rows in the FacetGrid
col (str, optional) – attribute to use as columns in the FacetGrid
plt_kwargs – parameters used in the FacetGrid if col/row is used.
kwargs (optional) – Additional parameters to pass to the seaborn plotting function.
- Return type:
matplotlib.axes.Axes or seaborn.axisgrid.FacetGrid
See also
Notes
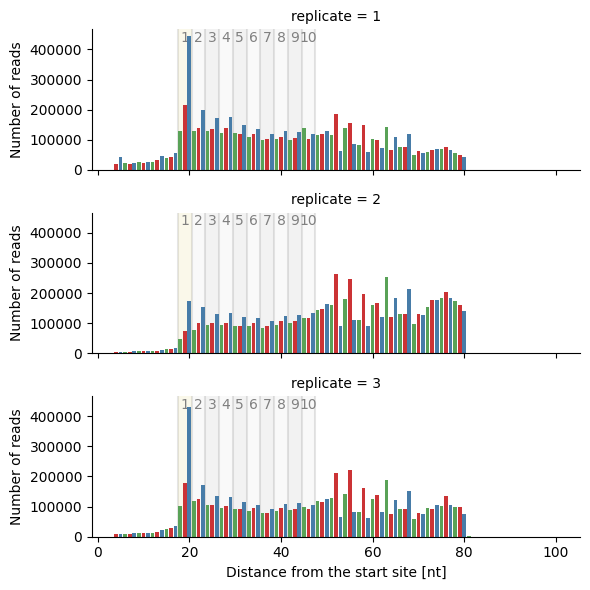
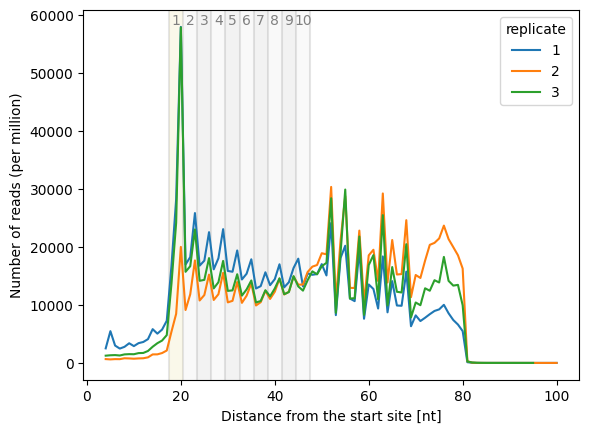
The x-axis represents the distance from the 3’ end of the inverse-toeprint in nucleotides.
The y-axis shows the counts of inverse-toeprints, either absolute or normalized per million reads.
Each replicate is plotted independently and distinguished by the hue attribute in the plot.
Examples
Create a line plot with all replicates:
>>> sample.itp_len_plot(norm=False)
Create a bar plot per replicate:
>>> sample.itp_len_plot(kind='bar', row='replicate')