itpseq.Sample.hmap_pos#
- Sample.hmap_pos(pos=None, *, how='aax', transform=<ufunc 'log2'>, cmap='vlag', vmax=None, center=0, ax=None, **kwargs)[source]#
Generates a heatmap of enrichment ratios per positions across ribosome sites.
This method visualizes the enrichment ratios as a heatmap, where the rows correspond to different ribosome positions and the columns represent amino acids / nucleotides.
- Parameters:
pos (tuple, optional) – Ribosome positions for which to compute and visualize enrichment ratios (e.g., (‘-2’, ‘E’, ‘P’, ‘A’)).
how (str, optional) – Type of inverse toeprints to analyze (see
Replicate.load_data).cmap (str or matplotlib.colors.Colormap, optional) – The colormap to use for the heatmap visualization. Defaults to ‘vlag’.
vmax (float, optional) – The maximum value for color scaling in the heatmap. If not provided, it defaults to the maximum absolute value in the enrichment matrix.
center (float, optional) – The midpoint of the colormap. Defaults to 0.
ax (matplotlib.axes.Axes, optional) – Pre-existing axes for the plot. A new figure and axes are created if not provided.
**kwargs (dict, optional) – Additional parameters passed to
get_counts_ratio_posto customize the enrichment computation or filtering.
- Returns:
The axes object containing the heatmap visualization.
- Return type:
matplotlib.axes.Axes
Notes
For amino-acids, the labels are colored to group them by biochemical properties.
Enrichment ratios are log2-transformed by default.
Examples
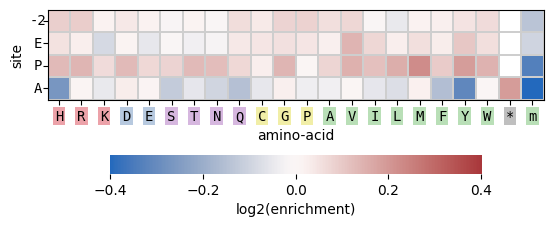
Create the default heatmap per position for -2/E/P/A:
>>> sample.hmap_pos()
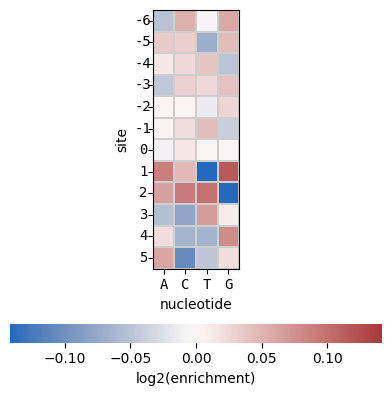
Create the default nucleotide heatmap per position for -6:5 (equivalent to -2/E/P/A amino-acids):
>>> sample.hmap_pos(how='nuc')